
“Facts are stubborn things but statistics are pliable.” – Mark Twain
In the ever-evolving financial landscape, the implementation of the revised Markets in Financial Instruments Directive (or simply, MiFID II) has been deceptively noise-free. However, on closer scrutiny, the impact can be felt on capital markets in general and particularly on the global investment research business. Any major change in regulatory policies unravels some challenges and opportunities for all participants, albeit with different vantage points. The impacts can broadly be sketched to a certain extent, but are difficult to be precisely established and could turn out to be contrasting to prior assumptions. MiFID II is one such change that has long-lasting implications for the European capital markets and investment research companies. Some anecdotal evidences are quite contrary to the popular wisdom.
MiFID II was in the oven for some time before getting implemented from January 3, 2018, while the original target for the launch was 2017. As such, the financial services industry was bracing for the change for quite some time. There were various concerns regarding the changes it might bring in, including lack of financial research coverage, job losses, and uncertainty on the impact of research costs. After a year of MiFID II implementation, it is an opportune time to take stock, and separate the reality from hypotheses and advance facts to take on the statistics (in the form of surveys, which one can find a-dime-a-dozen). For an interesting study such as this (albeit with limitations of a crimped timeline), we have taken a few common assumptions and tested them against actual data to ascertain the veracity of such assumptions.
Methodology: We have tried to keep our methodology as simple as possible to focus on the objectives rather than the means. We have used three distinct time slices for all the listed companies on the London Stock Exchange (LSE). The first time slice represents the market as it was before any meaningful disruption due to MiFID II (Slice 1: Jan-2016). The second time slice is the time during which MiFID II was formally getting implemented (Slice 2: Dec-2017), and the final time slice is the current scenario post-implementation of the MiFID II regime (Slice 3: May-2019).
The advent of MiFID II was expected to impact the availability of financial research coverage, given the increased transparency of costs as outlined by the MiFID II provisions. MiFID II provides greater disclosure of fees and separate disclosure (unbundling) of charges for investment research and trading. Traditionally, increased trading volumes for a buy-side firm would mean additional charges for the same quantum of research, which would be passed on to the clients. With the introduction of MiFID II guidelines, buy-side firms are required to decouple the payments made to sell-side firms for research activities and trading transactions. This implies setting aside a pre-decided budget for research that should ideally correlate with the quality and value addition to the buy-side firms. Sell-side research firms, on the other hand, are required to separate the research costs from the cost of execution, as outlined under MiFID II guidelines. According to a survey by the CFA Institute, in the lead-up to the MiFID II implementation, asset managers and brokerage houses were willing to pay for research costs against the firm’s overall profit, instead of passing the costs on to their clients. Accordingly, these companies were expected to curtail their research coverage (especially from the small-cap domain) and lower the use of sell-side research to offset the anticipated increase in costs.
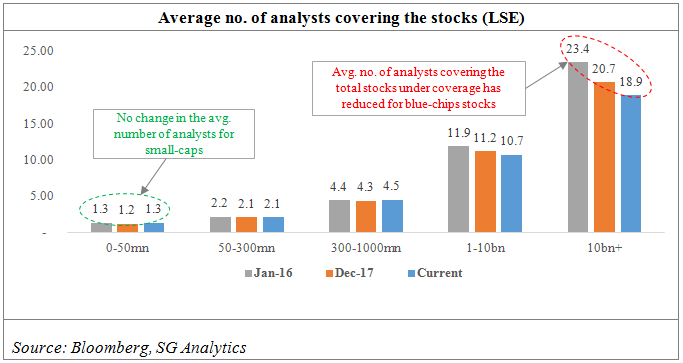
However, in contrast to the popular assumption of coverage loss, our findings across the three time slices suggest that there has been no significant difference in research coverage across companies of all sizes except for micro-caps (market cap of £0–50mn). During the pre-MiFID II period (before Jan-2016), brokerage houses covered all the 48 blue-chip stocks (market cap: £10bn+). This trend is still prevalent post one year of MiFID II, with coverage on all the blue-chip stocks (numbering 49) retained, implying no gap in coverage. However, the average number of analysts covering these stocks listed on the LSE has fallen to ~19 in recent times compared to ~23 during the pre-MiFID II period, implying additional stocks under coverage per analyst.
This would mean deteriorating quality of research and increased attrition rates. At the UK’s Investor Relations Society Annual Conference, Richard Buxton, Chief Executive of Old Mutual Global Investors (with £28bn in AUM), quoted, “We are seeing attrition of good analysts from the sell side. The quality of research is getting thinner and thinner.” Nonetheless, we do not see any correlation between the number of analysts covering the stock and its trading volume. For instance, the number of analysts covering Ohir Energy PLC (OPHR.L) has declined notably from 21 in 2016 to 7 in April 2019. However, the 3-month average trading volume (in value terms) for the stock has increased from £2.2mn to £8.3mn during the period. In contrast, the number of analysts covering Stock Spirits Group PLC (STCK.L) has increased from 4 in 2016 to 7, while its 3-month average trading volume declined from £0.6mn to £0.1mn during the corresponding period.
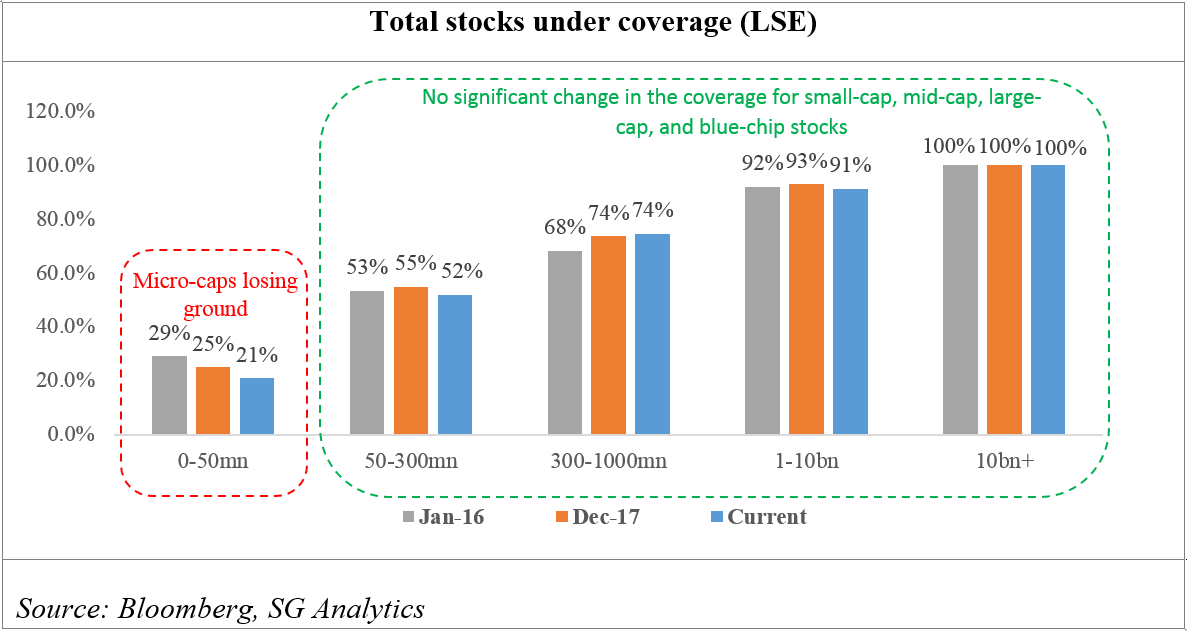
Research coverage across small-caps (£50–300mn), mid-caps (£300–1,000mn), and large-caps (£1.0–10bn) has also played out along similar lines as that of blue-chip stocks, with no significant change in their coverage over the period. The total number of analysts covering these stocks remained at a similar level, however. In contrast to the blue-chips, large-caps, and mid-caps, micro-caps (£0–50mn) experienced dark waters since the implementation of MiFID II. During Time Slice 1, there were 560 micro-cap companies listed on the LSE, of which 163 were on the coverage radar of brokerage houses (implying about 30% coverage). During Time Slice 2, this percentage shrank further to 25%, with 153 names out of 614 under coverage. The research coverage contracted further to 21% post one year of MiFID II implementation, with only 139 of total 667 micro-caps being covered. The total number of analysts covering the micro-caps remained stable over the period, however.
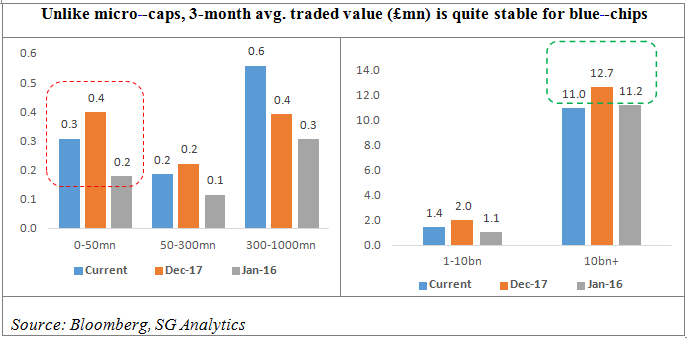
In terms of trading volume, the story is no different from the research coverage. Trading volumes of blue-chips have relatively remained constant after one year of MiFID II implementation as compared to the pre-MiFID II period. As of April 2019, the aggregate value of the 3-month average traded volume of 49 blue-chip stocks on the LSE was recorded at £11.0mn vs. £11.2mn as of pre-MiFID II (Jan-2016). Despite the lower coverage, the trading volume of micro-caps has improved over the period. The aggregate value of the 3-month average traded volume of total micro-caps under coverage stood at £0.3mn as of April 2019 vs. £0.2mn as in Jan-2016.
The disruption of MiFID II required a technological advent to comply with the underlying requirements of bringing in the transparency in the pre-trade and post-trade markets, as the pre-trade quotes and post-trade details are required to be made public within a stipulated time. Many of the firms in the market are finding it difficult to comply with the record-keeping requirements, as the incremental paperwork is an additional operational burden. Furthermore, the granular level of disclosure induced by MiFID II is making the trading process comparatively lengthier. Technology would have been a better solution for this increased level of complexity. However, the industry is still lagging in terms of putting the required infrastructure in place to produce the in-depth disclosures, given the lack of such disclosures in the first place along with the haziness around exact MiFID II requirements. Nonetheless, MiFID II guidelines of disclosures at the granular level would imply an ‘Opex + Capex’ game for investment research companies and brokerage houses, given the incremental operating costs as well as capital expenditure for technology.
The financial services industry is yet to come to terms with the changes that MiFID II has ushered in since its implementation. On the one hand, we see research budgets being cut by the buy-side (particularly the large asset management companies or AMCs) more than initially anticipated. On the other hand, broker commissions have also reduced drastically. A survey conducted by the CFA Institute (Nov-2017) observed that AMCs expect to pay a median of 10bps of their AUM (translating to $1mn for every $1bn) for investment research annually. However, some managers have spent lower than 1bps of their AUM for investment research, as told by several AMCs to The Financial Times. The budget cuts for investment research are much less pronounced in firms with a lower asset base. Moreover, the smaller asset managers are finding it difficult to absorb costs, unlike their bigger counterparts, which points toward a potential consolidation trend in the industry.
“The squeezed research houses are putting their efforts into the larger liquid stocks, rather than the lower-ticket small caps which are typically more difficult, and now more expensive, to analyse.” – Michael Horan, Head of Trading, BNY Mellon Pershing
The brokerage received by the sell-side entities has declined 30% annually in Europe, according to a report by McKinsey. As a result, the research houses (brokers) are consolidating to gain economies of scale. Additionally, in order to utilize its research department to the fullest, brokerages are focusing more on large-cap and blue-chip stocks, wherein the liquidity is significantly better compared to mid-cap and small-cap stocks. This is leading to relative congestion at the top end of the coverage pyramid, wherein the opportunities to uncover pricing inefficiencies are limited. The bottom of the pyramid (small- and micro-cap stocks) lacks the required attention (and capital) that it needs for the next set of billion-dollar companies to emerge. This is detrimental to the efficiency of the market, which is a prerequisite for its smooth functioning and is a precursor to lack of breadth. In this context, research firms should concentrate on their strengths and deploy the research bandwidth judiciously rather than following the herd. Contrary to the popular saying, “there is always room at the top,” our analysis suggests that there is room at the middle and the bottom as well.
Interested in the MiFID II journey? Here’s what we thought in 2017!
Sources:
https://www.ft.com/content/a4de8088-378d-3e39-bc6c-0efe736239a8
https://www.thetradenews.com/unpicking-research-unbundling-conundrum/
https://www.ft.com/content/5c32d1c8-658c-11e8-90c2-9563a0613e56