
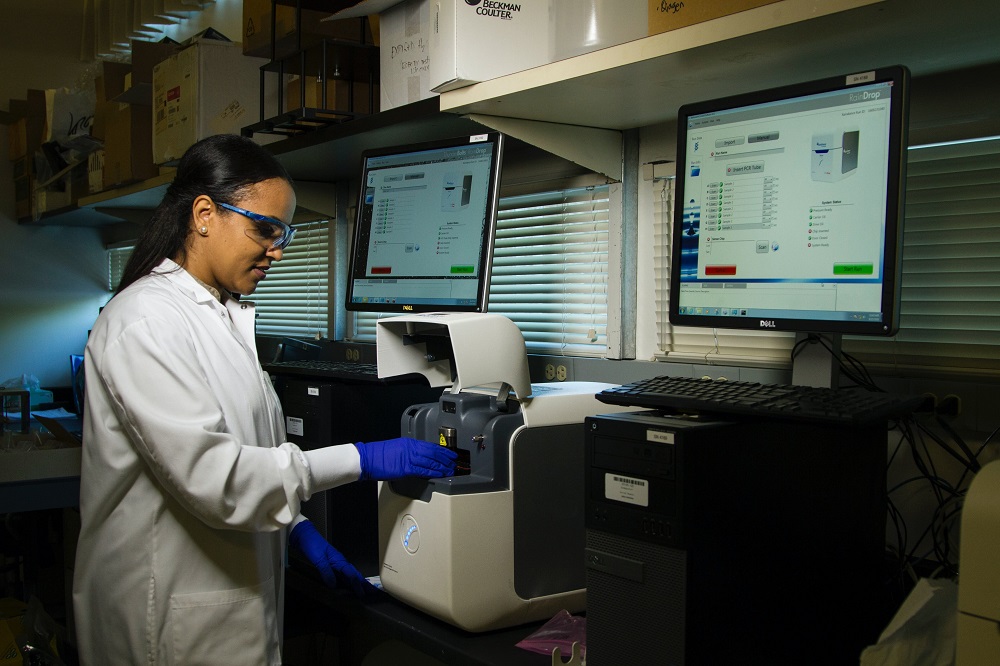
Data analysis plays a crucial role in numerous significant medical investigations that are currently underway. In order to effectively serve patients, doctors and nurses need to be able to use health interfaces, generate reports, analyze patient records, and identify patterns.
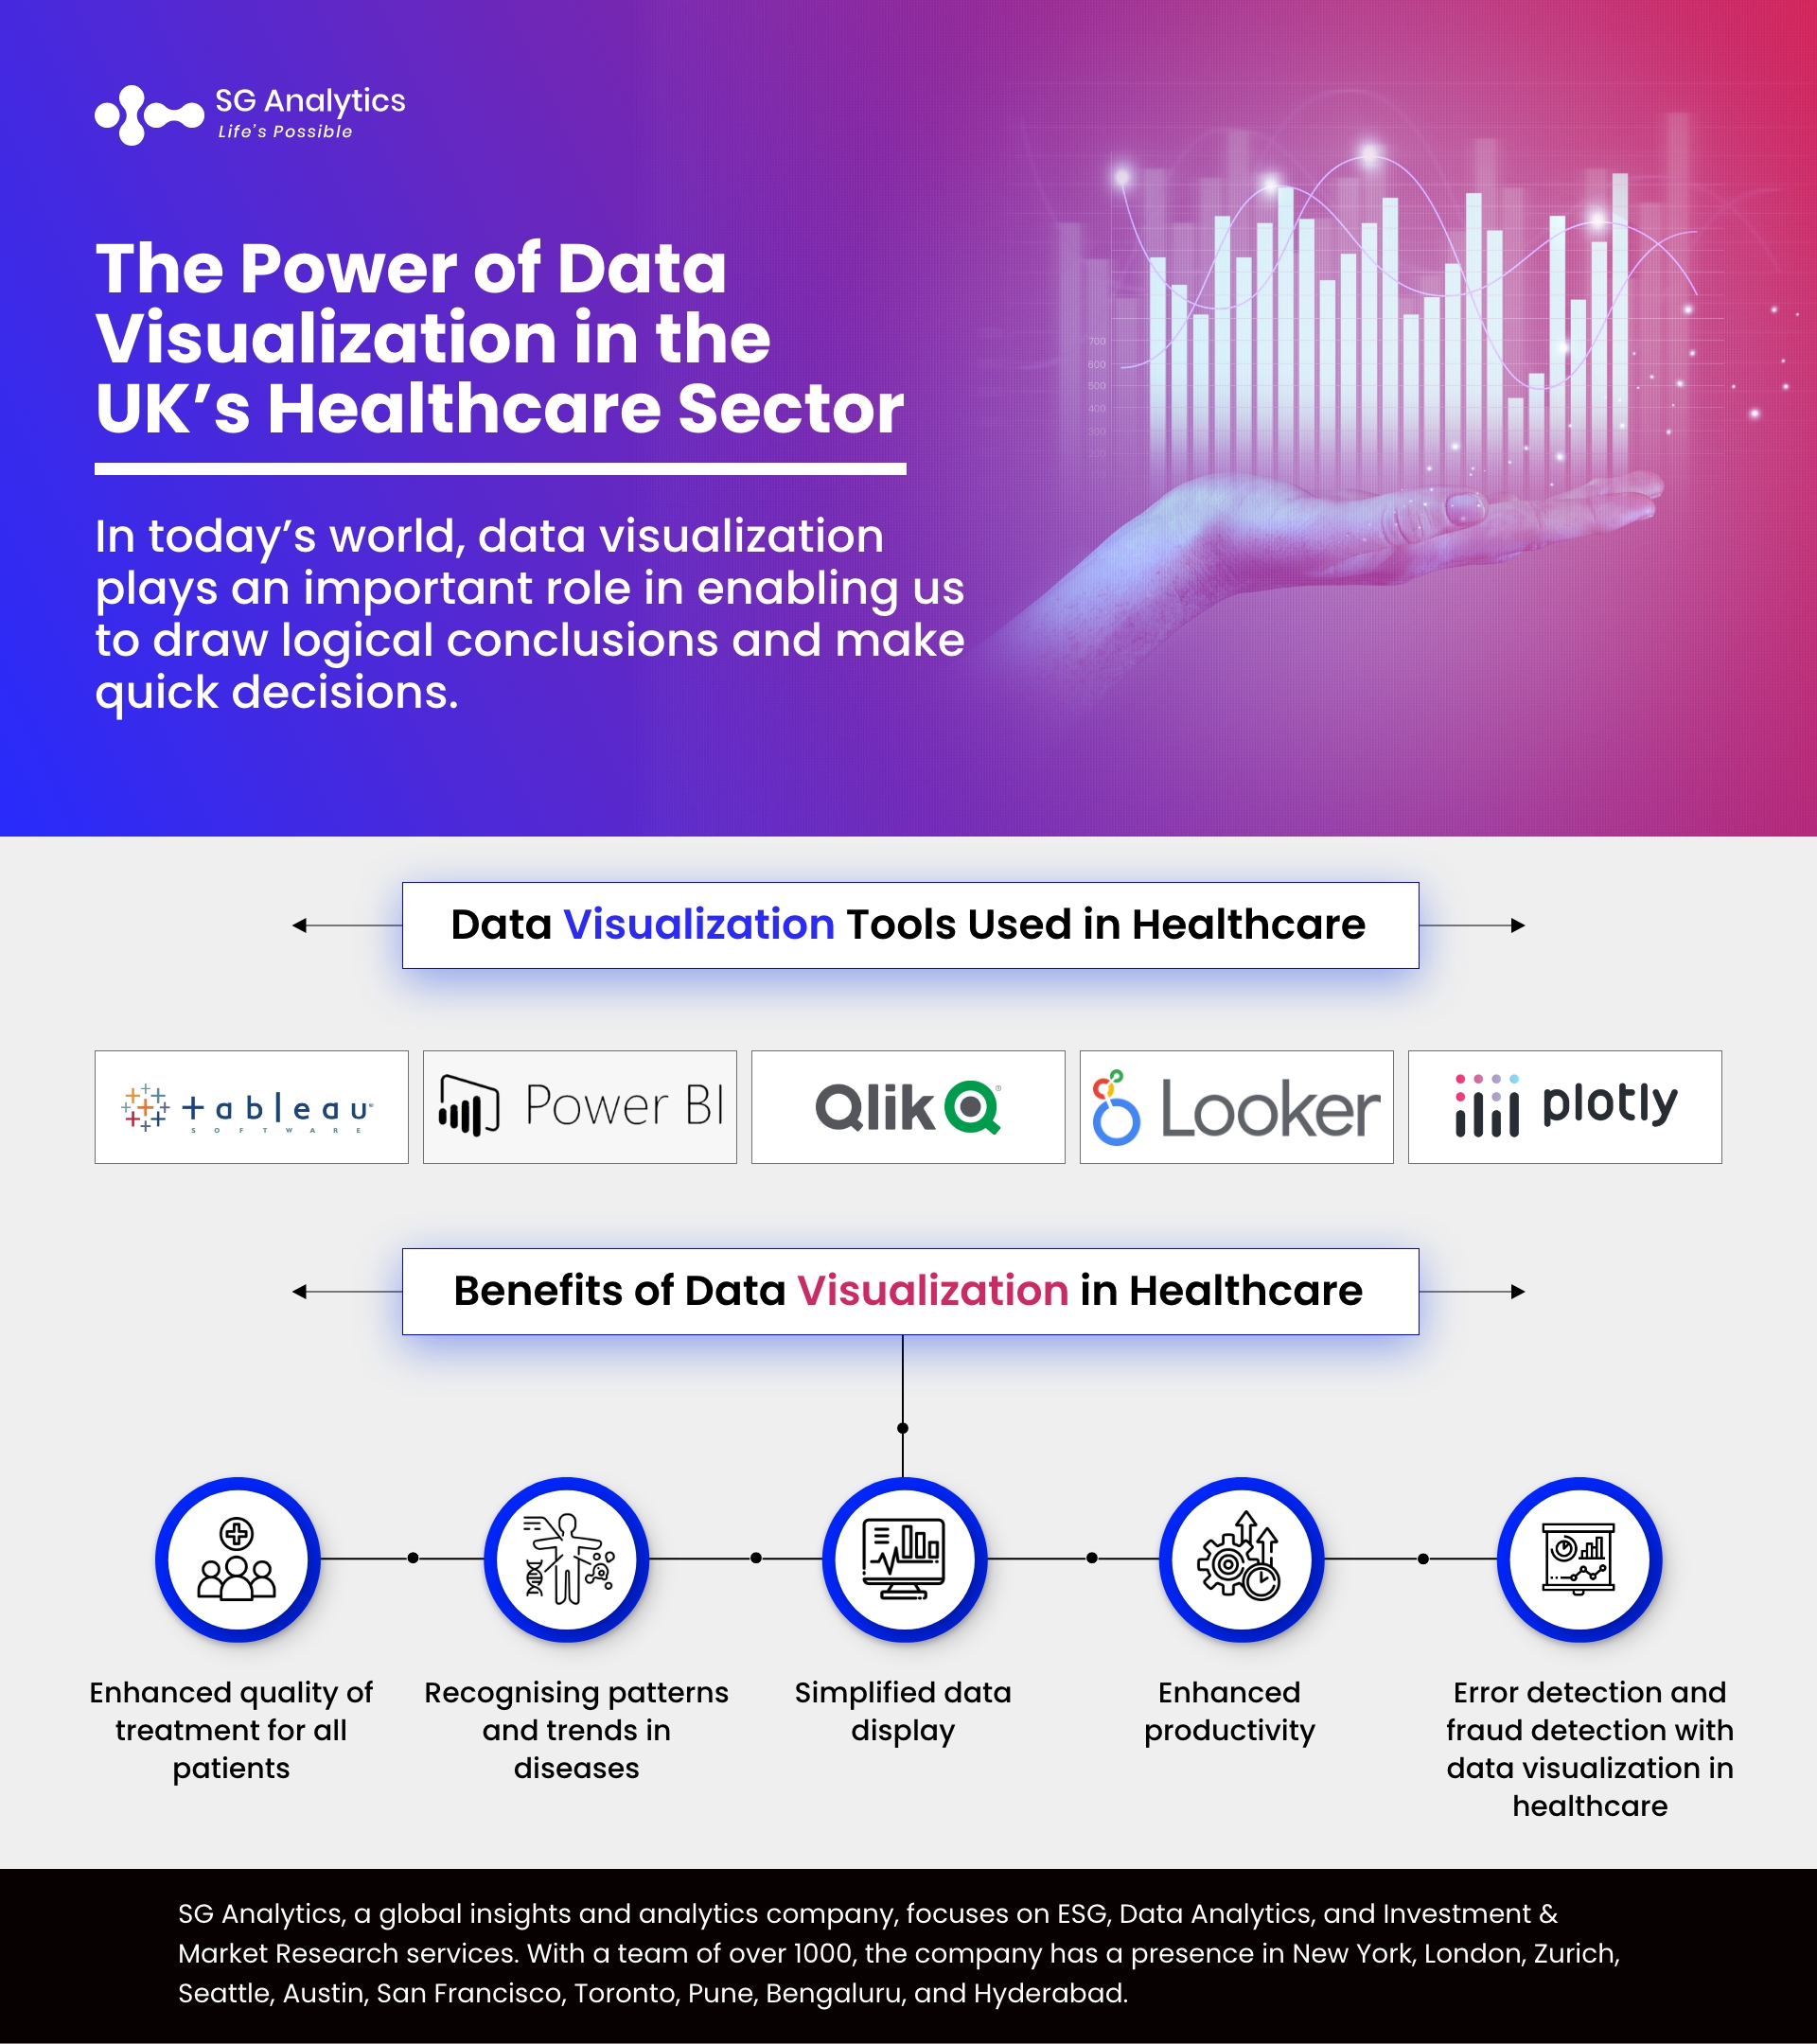
In today’s world, data visualization plays an important role in enabling us to draw logical conclusions and make quick decisions. With constant volumes of data being generated, it is important to be able to think quickly and efficiently. Efficient health imaging technologies are demanded by pharmaceutical companies, clinical research centers, and health insurance companies.
Big data has revolutionized data management, analytics, and applications. Data analytics and data visualization as a part of it have a huge impact on almost all businesses in the world. The healthcare sector is one of the biggest affected industries of all.
Health research has the potential to dramatically reduce medical costs, predict and prevent epidemic outbreaks, reduce avoidable diseases, and improve overall quality of life. Increasing life expectancy has required a rethinking of strategies currently using drugs. Like corporate owners, individuals in healthcare have the ability to sift through vast amounts of data to gain valuable, actionable insights.
Data visualization techniques and data analysis, such as machine learning and AI, have made it easier for the healthcare industry to operate in a much better way. They help to identify disease patterns and trends to an extent in certain areas and groups. It also helps in identifying appropriate health policies and lifestyle changes that may be significantly essential for improving health and wellness.

How is Data Visualization used in Healthcare?
The use of digital technologies to store patient records and help manage clinical practice has created a wealth of information that would otherwise be overwhelming and cumbersome using outdated methods.
The use of big data analytics in medicine offers many potential benefits, including the potential to save lives. Big data is a term used to describe the amount of data generated by anything that is digitized and then aggregated and analyzed by specialized software. When applied to healthcare, personal or public health information is used to provide results, output is improved, and costs are saved.
As life expectancy increases, so do treatment options, and many advances are driven by new information. Because any disease is easier and cheaper to treat when caught in its early stages, doctors like to learn as much as possible about their patients,. Prevention is better than treatment from an early age, and insurance can provide the right plan for everyone. This is an attempt by management to address the problem of keeping patient information in silos across locations, making it difficult to share information effectively.
The number of places doctors and other medical professionals can go to learn more about their patients is growing. These issues are common in file formats and formats, causing problems for the end user. But what matters now is how pretty the data is, not how "big" it is.
Smart and fast data extraction can be achieved from the following healthcare industry sources with the help of the right technology:
-
Patients portals
-
Research studies
-
EHRs
-
Wearable devices
-
Search engines
-
Generic databases
-
Government agencies
-
Payer records
-
Staffing schedules
-
Patient waiting room
Medical data collection has been a laborious and costly task for quite some time now. The rapidly changing technology of today enables us to not only gather data but also generate detailed healthcare reports and convert them into actionable, essential insights for better treatment.
Through evidence-based insights, healthcare data analysis strives to enhance patient outcomes by preventing issues from worsening, accelerating the evaluation of new treatments and procedures, optimizing inventory management, fostering greater patient participation in their care, and granting them the knowledge necessary to make informed choices about their health.
Types of Data Visualization in the Healthcare Sector
Various varieties of visualizations can be used to present healthcare data in a more comprehensible format, such as:
Charts & Graphs - In healthcare, the most prevalent forms of visualization are graphs and charts.
Line charts - These are used to illustrate the trend of a variable over time.
Bar graphs - Used to compare values across categories; Scatter plots: Used to demonstrate the relationship between variables.
Geographics Infographics - These are graphical representations of data and information that can communicate complex data in an engaging manner.
Maps - Maps are used to visualize geographic data, such as disease prevalence or health outcomes, and to identify regional patterns or trends.
Dashboards - They are graphical representations of key performance indicators (KPIs) and metrics that provide a quick overview of crucial data. Dashboards can be used to monitor the health status of patients in real time, measure clinical quality metrics, and monitor population health trends. Typically, they combine charts, graphs, tables, and other visual elements to provide a comprehensive view of the data.
Which Data Visualization Tools are Used in Healthcare?
Let's have a look at a few of the most well-known off-the-shelf options for simplifying and optimizing data visualization in the healthcare industry:

Tableau
Tableau is the industry-standard data analytics platform, packed with powerful features and convenient machine learning add-ons. It includes a straightforward, drag-and-drop interface that makes it easy to get started. Therefore, individuals with little technical knowledge may make line charts, graphs, and histograms.
Power BI
Power BI is a business intelligence tool created by Microsoft that allows users to create dashboards, reports, and visualizations with ease. Its superior analytics and capacity for integration make it a preferred option in the medical industry.
QlikView
QlikView has strong data exploration tools and a user-friendly drag-and-drop interface. With its associative approach, complicated medical data may be visualized in a way that facilitates dynamic navigation and the discovery of previously unseen insights.
Looker
Looker is a cloud-based data platform that allows users to easily access, explore, and visualize medical data from a single location. The system's adaptability and built-in communication features make it ideal for use in collaborative healthcare settings.
Plotly
Plotly is a free and open-source library that may be used with many different languages. Because of its flexible design, it is often used to show individual patient records in great detail.
Benefits of Data Visualization in Healthcare
The healthcare industry benefits greatly from the use of data visualization, along with other tools and techniques. Improved healthcare delivery, higher quality patient care, and the identification of fraud and mistakes are all possible outcomes of the widespread adoption and use of visualization tools in the healthcare industry.

Enhanced quality of treatment for all patients
The use of data visualization in healthcare has a favorable effect on the delivery of care as a whole, helps clinicians make better decisions, and improves preparedness for emergencies.
Improving the quality of treatment and allowing healthcare practitioners to make required clinical decisions depending on the patient's situation necessitates real-time visualization of patient health data. Data visualization tools, for instance, aid in the continuous monitoring of vital signs like oxygen saturation, allowing for immediate analysis of patient reactions to therapy. Providers have a much easier time spotting anomalous values and initiating the necessary action when real-time data visualizations are used, leading to better patient outcomes and overall healthcare quality in the hospital.
Recognising patterns and trends in diseases
Determining healthcare trends is crucial for deciding how to allocate resources. In order to encourage people to make positive lifestyle changes and counteract potential health risks, it is essential to first identify and then analyze illness trends among certain groups. A greater public and patient awareness of the need to alter their lifestyles might result from a better understanding of the causes of the trends.
Simplified data display
The ability to show data to many audiences is another significant benefit of healthcare visualization methods. When compared to laypeople, healthcare data might be more difficult to comprehend among doctors working in diverse specialties. The goal of any data presentation should be to make even the most complicated facts understandable to listeners from any cultural or linguistic background. Putting medical data to good use and making it accessible to a wide range of audiences is the use of presentation techniques to explain illness prevalence and the variables impacting it.
Enhanced productivity
By facilitating rapid clinical decision-making in emergency scenarios, for example, data visualization in healthcare organizations can improve the prognosis and health condition of their patients. Additionally, increased speed can lessen care deficiencies, ensuring greater output from healthcare organizations and establishing a solid track record for efficacy and improved patient results.
Error detection and fraud detection with data visualization in healthcare
For example, medical billing fraud may be uncovered through the application of health data analytics and visualization tools within healthcare organizations. Duplicate billing, phantom billing, fake prescriptions, and other kinds of insurance fraud by healthcare practitioners are the most common types of billing fraud in healthcare institutions. The accuracy of billing and the prevalence of fraudulent schemes can both be improved through improved communication between patients, healthcare payers, and providers.
In What Ways is Data Visualization Transforming Healthcare?
There is a lot of demand in the healthcare industry to increase patient satisfaction, reduce costs, and increase patient volume on a daily basis. The next time you wait longer than usual to see your doctor or see him seem upset. Meanwhile, healthcare providers must contend with an explosion of new data, including electronic health records (EHRs), wearable devices, and clinical trials.
When this information is carefully analyzed and presented in a meaningful way, it can help healthcare professionals make better decisions and improve patient outcomes. Otherwise, this information will just take up unnecessary space on your computer.
That’s when charts and graphs come in handy. Visualization of health information, through the creation of healthcare applications, can assist decision-makers in rapid pattern recognition, identification of details, and comparisons between methods and patient data through optimized applications, by presenting information in an attractive and easy-to-understand format -management and service access can be simplified.
Read Also - Why Data Visualization is Crucial for Modern-day Businesses?
Conclusion
Data visualization plays a crucial role in the healthcare sector as it offers conceptual assistance by facilitating intuitive comprehension of intricate data. A dynamically evolving healthcare environment underscores the significance of this data visualization.
In light of the growing reliance on data in several domains, the capacity to effectively analyze and respond to intricate healthcare insights will assume more significance. The implementation of data visualization tactics within the healthcare industry is anticipated to yield advantageous outcomes, facilitating the attainment of enduring prosperity for healthcare providers.
Healthcare organizations can leverage visualizations to improve operational efficiency, enhance informed decision-making, and improve patient outcomes, among other things.
At SGA, we embrace a design thinking approach to create intuitive and impactful data visualizations. Our data visualizations services prioritize user experience and effective communication, ensuring that they are both visually appealing and insightful. Providing businesses with clear, visual representations of complex data enables them to gain meaningful insights and make informed decisions.