As businesses are becoming more and more data-centric, companies are on a constant lookout for effective means to harness big data and benefit from its transformative potential. Data analytics, a subdivision of data science, is an enabling technology that aims to help organizations capitalize the behemoth data that is growing at an exponential rate currently.

Insights-driven businesses witness a 30% growth every year (Forrester). In simple terms, data is driving today’s world and frontier technologies such as data analytics, AI, machine learning, deep learning, etc. play a major role in unleashing the potential of big data.
Big data analytics has practically disrupted almost all markets. The stock market is no exception. Let’s understand the impact of data analytics in the stock market universe and how it is influencing trading in the digital age.
Impact of data analytics in the stock market
Economic globalization is profoundly influencing the value of stocks today. For instance, a plane crash in Asia quickly impacts the manufacturer’s stock value in American exchanges. Price sensitive data is generated at scale and lightning speed today, which makes it even more complicated for the human brain to process and digest the voluminous data completely.
Aspects such as constant monitoring of data, quick and accurate processing of the tick-by-tick price, real-time news feeds, even tweets to glean timely insights, are beyond human capabilities. However, machines can perform these tasks continuously and tirelessly. Though technologies like data analytics and machine learning are nowhere near perfect yet, they certainly complement human capabilities to perform better diversification, risk management and trade cost-cutting.
In the world of the stock market, it is not a matter of man vs machine, rather man and machine, as together with human intelligence and technologyadvancements, individual investors and traders can gain the ability to promptly respond to the fast-changing market conditions.
While humans possess the ability to analyze data in a contextual manner and create a convincing hypothesis, enabling technologies such as data analytics and machine learning, collectively enable people to validate, test, and execute the hypothesis more efficiently. In fact, financial technology innovations are enabling traders and individual investors to learn more about algorithmic and quantitative trading to keep pace with changing market dynamics and seize potential opportunities at the right time.
Basic data science concepts in the stock market
By tapping into the potential of data science, institutional investors, as well as individuals, can predict the future price value of stocks and make smart investments and trading. Following are some of the data science concepts used in the stock market:
Algorithms
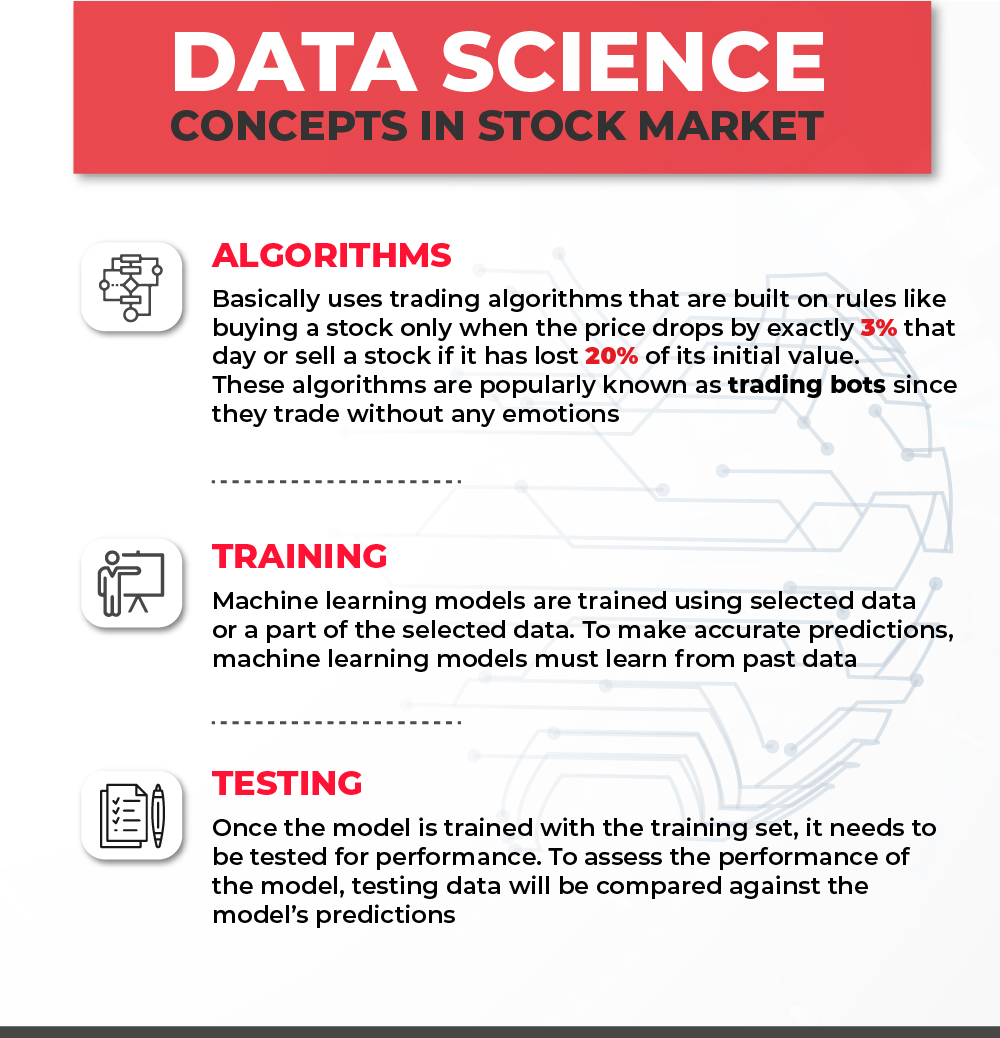
Algorithms are the crux of programming and data science. In simple terms, algorithms are just a set of rules that perform a particular task. Algorithmic trading, which is extremely popular in the stock market space, basically uses trading algorithms that are built on rules like buying a stock only when the price drops by exactly 3% that day or sell a stock if it has lost 20% of its initial value. This is a simple example to understand the functioning of algorithmic trading.

The interesting part is that these algorithms can run without human intervention. These algorithms are popularly known as trading bots since they trade without any emotions.
Training
In the case of data science and ML, machine learning models are trained using selected data or a part of the selected data. To make accurate predictions, machine learning models must learn from past data. The entire data set is usually divided into two parts – training data set and testing data set. Generally, the split up is 80/20 – in which 80% of data is used for training.
Testing
Once the model is trained with the training set, it needs to be tested for performance. This is where the remaining 20% of data comes into play. The data is generally known as the testing data or the testing set. To assess the performance of the model, this testing data will be compared against the model’s predictions.
To get a clearer understanding, assume that there’s a model well-trained on stock price data collated over the first half of a year. Say, the data from January to April is the training set, and the data from May and June is the testing set. Now the model will be trained on the training data – Jan to Apr prices, and made to predict the stock prices for the next two months – May and June. Comparing the result data against the real data helps in underling the errors and optimizing the model.
The role of modelling in predicting the stock value
Modelling is at the heart of data science. It basically leverages a mathematical approach to analyse historical data and forecast future outcomes based on past behaviours. The commonly used models to predict stock prices include: time-series and classification, wherein the time-series model is often used when it comes to the stock market and financial data.
Below is a brief description of the two models:
Time-Series modelling
The time-series model is a series of data indexed over a period of time. In the case of the stock market, the series of data is the price value of a stock, and time could be anything such as a minute, hour, day, month, etc. Most stock charts present data in a time-series model. Machine learning or deep learning is used to construct the time-series model. Once the data is fit into the model, data scientists or any other users will be able to forecast future price value of a stock for a selected period of time.
Classification modelling
Data analytics and machine learning use classification modelling to classify certain data points and then predict future outcomes from these data points. In the stock market, financial data like total debt, P/E ratio, and daily volume play a crucial role in deciding the price of a stock. Using the classification machine learning model, this financial data can be quickly and accurately classified into three different categories: buy, hold, and sell.
Overfitting & Underfitting
Performance of the above-discussed models may not always be as expected. Sometimes the errors may discredit the actual capabilities of the models. Following are the performance-measuring terms of the models:
Overfitting refers to the state when the model predicts complexly and reaches a point where it misses the correlation between the target variable and the feature. Overfitting becomes a crucial problem when the model has difficulties in identifying stock market trends and thereby, is unable to adapt to future events.
Underfitting occurs when the model is unfit for the data and the predictions are extremely simple. For example, a model predicting average price based on entire stock history falls under the underfitting category.
However, both overfitting and underfitting are hazardous and result in poor predictions that cannot be relied upon.
Summary
The world is drowning in an overwhelming quantity of information today. In the universe of stock market and financial data, time and numbers play a crucial role in determining the value of a stock. Employing the capabilities of data analytics, investors and traders can become more and more data-driven and improve their ability to identify opportunities and trim trading costs.